Introduction
PlotKit is a Chart and Graph Plotting Library for Javascript. It has support for HTML Canvas and also SVG via Adobe SVG Viewer and native browser support.
PlotKit is fully documented and there is a quick tutorial to get you started.
PlotKit is a complete rewrite of CanvasGraph. It is better structured and supported.
Requirements
- MochiKit 1.3 or higher
- HTML Canvas: Safari 2+, Opera 9+, Firefox 1.5+, IE 6 (in emulated mode)
- SVG: Opera 9+, Firefox 1.5+ (see note), IE6 with Adobe SVG.
Note: Firefox 1.5+ on Linux and Windows is supported. Firefox 1.5+ on
Mac does not draw labels in SVG, so you must set axisLabelUseDiv
to true if you want to have maximum compatibility.
License(s)
- PlotKit is copyright (c) 2006 Alastair Tse. Licensed under the BSD License.
- excanvas.js is copyright (c) 2006. Google Inc. Licensed under the Apache License.
Get/Download
- Latest Version is : 0.9.1 - plotkit-0.9.1.zip
- Last Updated: 29 August 2006
- For changes in this version, look in PlotKit Documentation.
- Older Versions:
Documentation
- PlotKit Documentation - Complete documentation
- PlotKit Quick Start
Development
- PlotKit Mailing List - Ask questions here.
- PlotKit Source Code - SVN Repository Browser
- PlotKit Wiki - If you have notes to contribute, here is the place.
- SVG/Canvas Browser Status - A summary of notes I have written about SVG and HTML Canvas in various browsers.
Examples
- PlotKit Dynamic Charting Test - Redrawing values from a dynamic table.
- PlotKit Simple Canvas Demo - A self contained demo in a single file. Use this to get started!
- PlotKit Simple SVG Demo - A self contained demo in a single file. Use this to get started!
- Sweet Canvas Test
- Sweet SVG Test
- Simple Canvas Test
- Simple SVG Test
- liquidx.net Stats Page
Demo
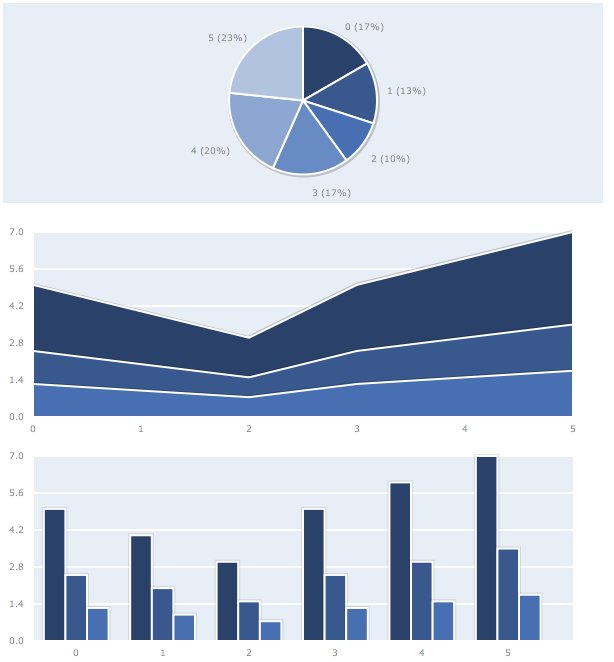
Below is a demo of a simple HTML Canvas example which should work in Safari 2, Firefox 1.5, Internet Explorer 6 and Opera 9. And SVG Demo can also be found.
This is the HTML in the above demo:
<div class="demo" id="canvaspie" width="600" height="200"></div>
<div class="demo" id="canvasline" width="600" height="200"></div>
<div class="demo" id="canvasbar" width="600" height="200"></div>
And the Javascript that is needed to draw the charts:
    function demo() {
       var hasCanvas = CanvasRenderer.isSupported();

       var opts = {
       "pieRadius": 0.4
       };

       var data1 = [[0, 5], [1, 4], [2, 3], [3, 5], [4, 6], [5, 7]];
       var data2 = [[0, 2.5], [1, 2], [2, 1.5], [3, 2.5], [4, 3], [5,
       3.5]];
       var data3 = [[0, 1.25], [1, 1], [2, 0.75], [3, 1.25], [4, 1.5], [5, 1.75]];

       if (hasCanvas) {
           var pie = new EasyPlot("pie", opts, $('canvaspie'), [data1]);
           var line = new EasyPlot("line", opts, $('canvasline'), [data1, data2, data3]);
           var bar = new EasyPlot("bar", opts, $('canvasbar'), [data1, data2, data3]);
       }
    }
Screenshot
If you do not see the above, this is what you should have seen:
About
PlotKit was created by: Alastair Tse - alastair@liquidx.net