Unmaintained
CanvasGraph is now replaced by PlotKit which offers the same functionality as CanvasGraph but also includes SVG support and preliminary event support. CanvasGraph will not be updated any more.
There is now a PlotKit mailing list for thos who are interested in using or further development with graphing in Javascript.
- Alastair Tse (21st March 2006)
Introduction
Canvas Graph is a small simple javascript library that allows you to conveniently plot simple line, bar and pie charts using the new HTML Canvas Tag.
The motivation for this work is to allow simple graph plotting in Javascript without resorting to anything but your web browser. I'd like the library to be simple enough for someone who knows very little Javascript to be able to use, but extendable so that people who know what they're doing to make great looking graphs for their sites.
Don't know what the Canvas HTML Tag is? Learn more about the Canvas Tag below. Also if you want to know why this is using Canvas tag rather than SVG?
Pages that Use CanvasGraphRequirements
Note: This does not work on Internet Explorer.
Features
- Plot bar charts, line graphs and pie charts
- Plot multiple datasets on one graph.
- Data input from javascript arrays, or even automatically extracting data from HTML tables or text files.
- Flexible customisable layout and colour scheme.
- Fully documented and open source.
- Unit Tests
Download
Current Version: CanvasGraph.js - 0.7 (Last Updated: 13th Jan 2006)
- 0.7 current (13th Jan 2006) - Major reorganisation. Moved into own namespace so it can work with Dojo and other strict frameworks without polluting the global namespace.
- 0.6 old (27 Dec 2005) - Major bugfix release. Fixed bar charts with proper positioning and handle single value datasets. Added flexibility with pie chart inputs.
- 0.5.1 old (16 Dec 2005)- Minor bugfix with drawGrid when using custom colors. (Thanks to Philippe Marschall)
- 0.5 (11 Dec 2005) - Initial Public Release
Unit Tests Page
Here is a constantly updated Unit tests page to prevent regressions between versions, and also demonstrate some basic plotting.
Dynamic Graph Page
Dynamic Graph Generation using Javascript and Tables.
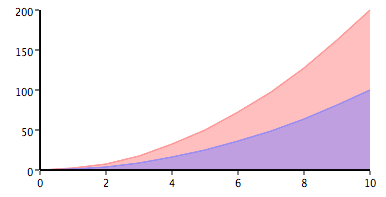
Simple line plot of two data sets: square numbers and 2 * square numbers
View Source: LinePlotDemo.js
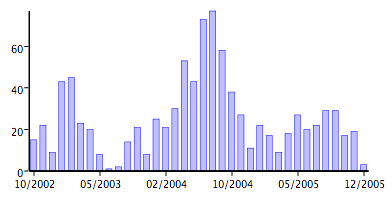
Simple bar chart of 1 data set with custom labels
View Source: BarChartDemo.js
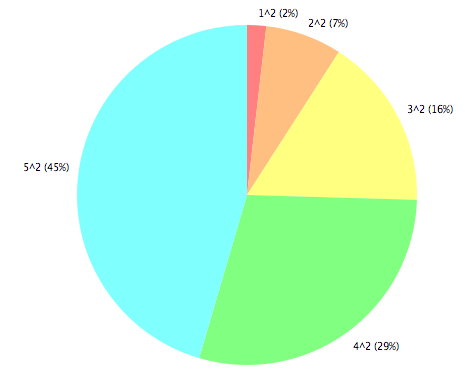
Simple pie chart of powers of 2.
View Source: PieChartDemo.js
Data from a table
| x | x2 | x! | sqrt(x) |
|---|---|---|---|
| 0 | 0 | 0 | 0 |
| 1 | 1 | 1 | 1 |
| 2 | 4 | 2 | 1.414 |
| 3 | 9 | 6 | 1 |
| 4 | 16 | 24 | 2 |
| 5 | 25 | 120 | 2.23 |
View Source: TableBarChartDemo.js
Screenshots
Here are some examples of the same graph above rendered in Mozilla Firefox 1.5 under Mac OS X.
Documentation
CanvasGraph.js consists of just one single class that you should use, the CanvasGraph object.
CanvasGraph Class Functions
- CanvasGraph.isSupported(canvas_name)
Returns true if canvas tag is supported in the current browser, otherwise false. The optional parameter canvas_name can be used to specify the id of a canvas tag that is already in the document.
Learn more about the HTML Canvas Tag
Canvas Tag was first introduced by Apple as an extension to HTML in order to allow more expressive use of Javascript and HTML in their Apple Dashboard Widgets. It was subsequently introduced to the WHATWG workgroup and proposed in their draft standard.
Related Links:
- WHATWG Canvas Tag Specification
- Apple Documentation of the Canvas Tag in Safari 2.0
- Mozilla Documentation of the Canvas Tag
- Canvas SVG - Translating between Canvas Tag and SVG.
Canvas Tag vs SVG
Probably the first thing someone asks is why bother with Canvas tag and not do it with SVG?
Good point. It just so happens that my primary browsers are Safari and Mozilla Firefox, and the thing they have in common is the Canvas Tag, and unfortunately not SVG.
Secondly, I'm reasonably competent at the stack based graphics API like OpenGL that is presented with the Canvas Tag. So doing graphing is a piece of cake for me in that API, whereas I don't even know where to start with SVG.
With that said, I will like to do an SVG version eventually. As long as I'm allowed to construct the SVG DOM directly from Javascript, then it shouldn't be hard (in fact trivial) to do it in SVG. Watch this space for more -- or at least I have to change the name of this project!
About
By: Alastair Tse [alastair^tse.id.au]
License: BSD License